Welcome to the Occidental College Graduation Outcomes page! Here, you will find a collection of interactive dashboards and other data that provide insights into the post-graduation pursuits of our recent alumni, offering a comprehensive view of their career and academic paths as reported within six months of completing their bachelor’s degrees.
The First Destination Survey is conducted through Handshake, our career services platform, following standards set by the National Association of Colleges and Employers (NACE). The survey gathers data on students who graduated with a bachelor's degree between July 1st and June 30th of a graduating class year.
The interactive dashboards and other data found here serve as a valuable resource for students, alumni, and prospective students and their families, providing a clear picture of Occidental graduates’ successful transitions into the workforce or further education.
Data sources: Classes of 2021, 2022, and 2023 graduation surveys as reported in the first six months post graduation.
How to use the interactive dashboards
The dashboards allow users to interact with the data in multiple ways:
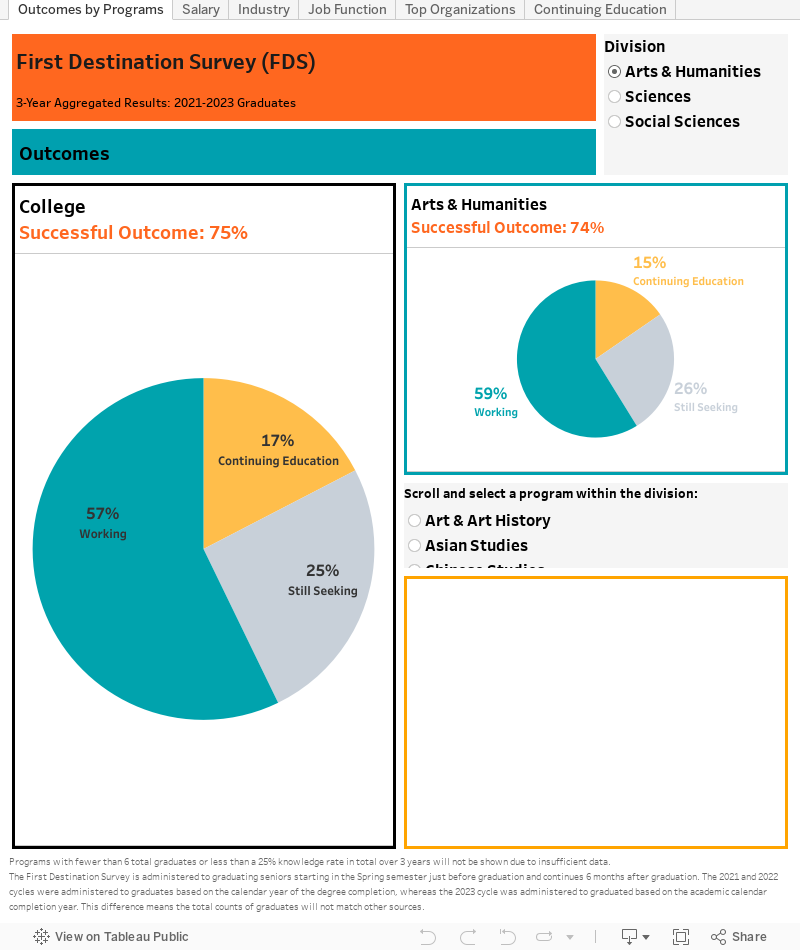
- Academic Programs: Click on different majors to see whether graduates from each program pursue the job market or further education.
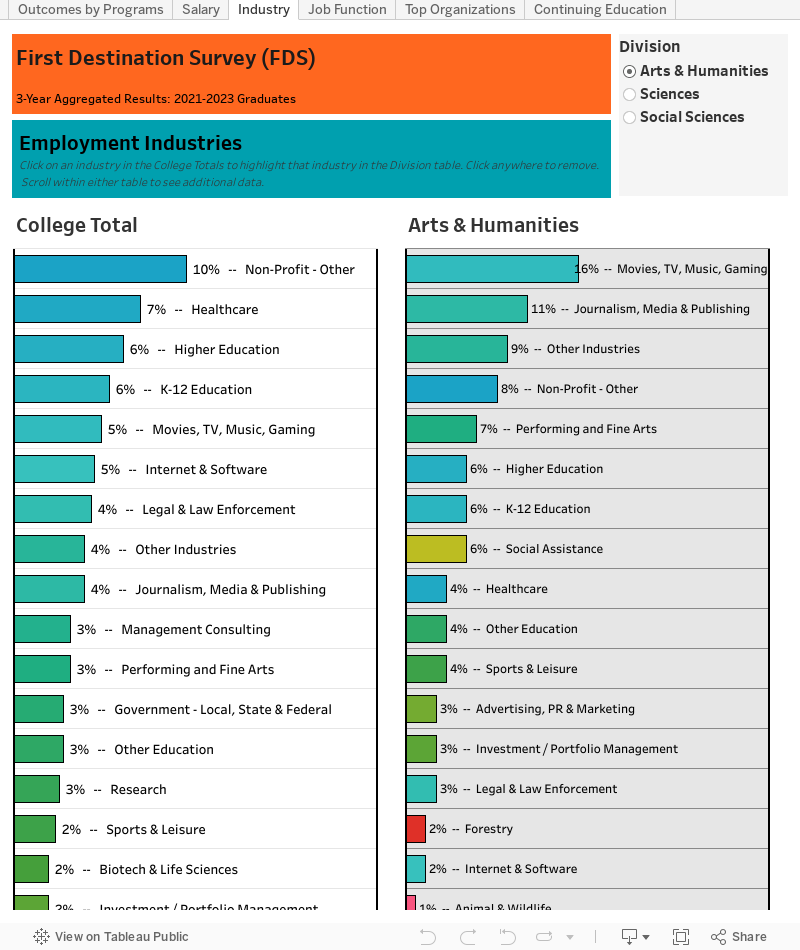
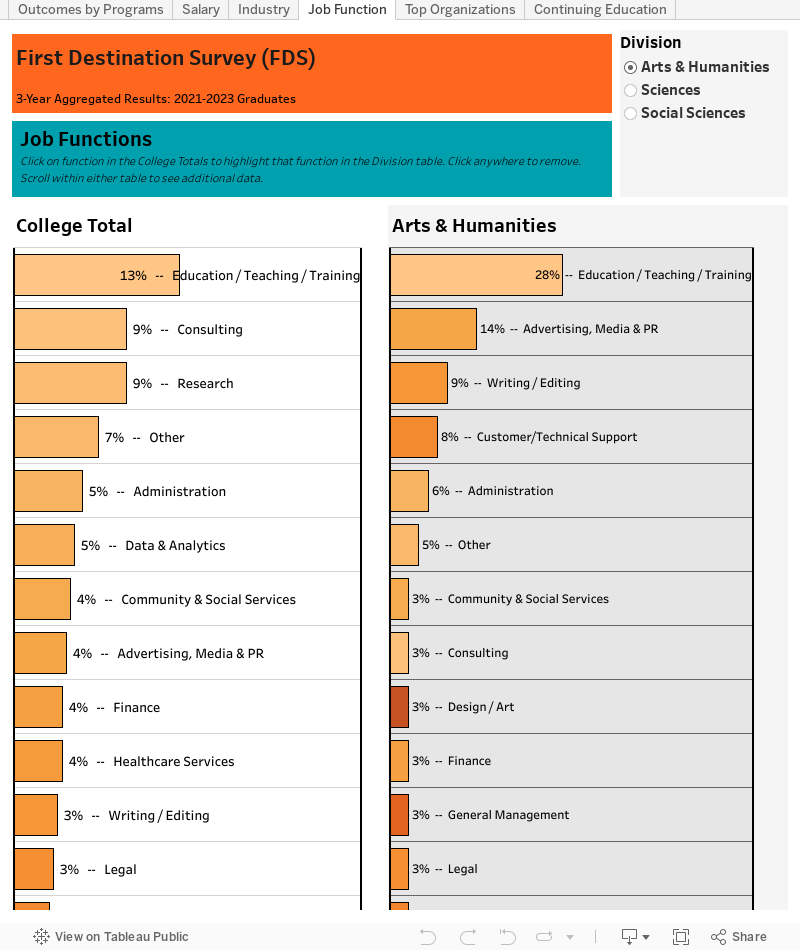
- Top Employment Destinations: Explore which industries are hiring Oxy graduates and the role or responsibilities a graduate holds within their organizations.
The data in the dashboards is interactive—simply click on any category to filter results by program, industry, or job function. This allows you to explore specific outcomes, helping you better understand the career trajectories of Occidental graduates.
Dashboards and Other Data
Overall Outcomes
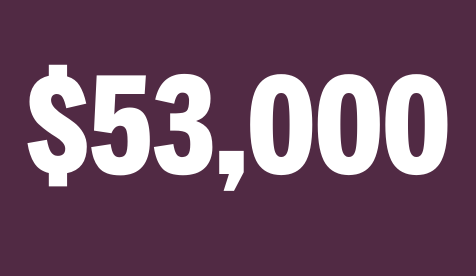
Median Salary
Industries
Job Functions
Notable Employers
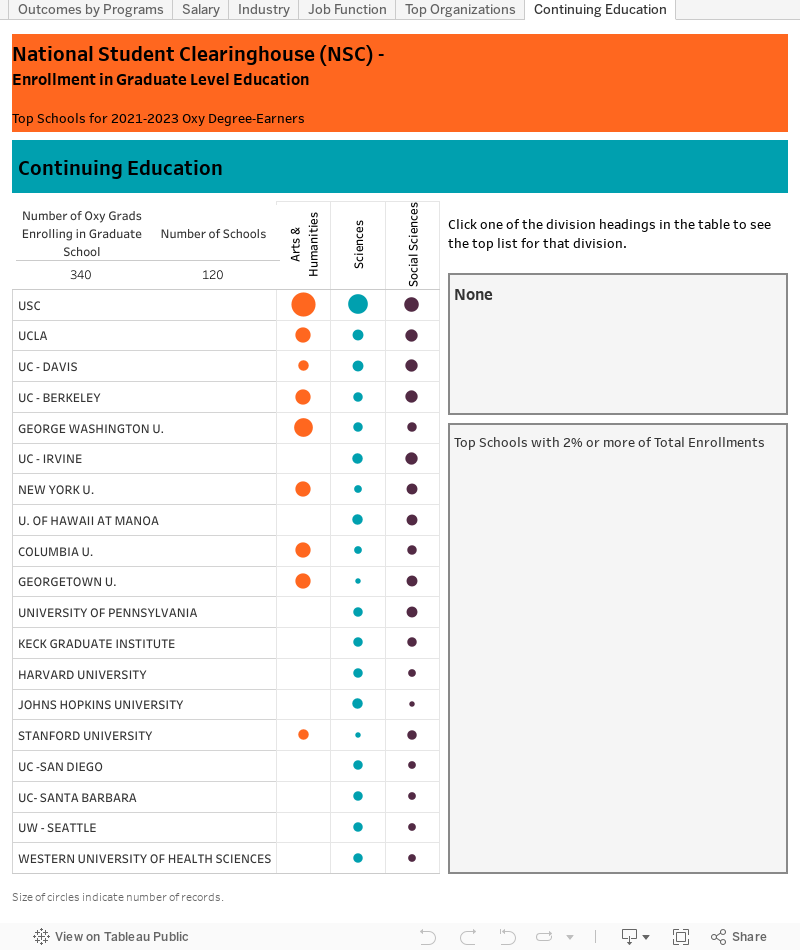
Continuing Education
Overall Outcomes
Definitions
Working: Recognizing the diverse nature of employment, there are a number of important sub-categories defining employment that are tracked for individual graduates within their first six months post graduation, as reported through the graduation survey via graduate responses or knowledge-based answers. Graduates in this category are:
- Employed as an entrepreneur
- Employed in a temporary/contract work assignment
- Employed freelance
- Employed in a postgraduate internship or fellowship
- Employed in all other work categories, including military or volunteer service
Continuing Education: Graduates who have enrolled in postgraduate or professional programs in the first six months post graduation, as reported through the graduation survey via graduate responses or knowledge-based answers.